Starting a Business Continuity/Disaster Recovery (BC/DR) Program – Part II

This series is dedicated to providing direction for applying Project Management principles to starting a Business Continuity or Disaster Recovery (BC/DR) Program.  This is the second installment of a multi-part series.  In this installment we will focus on the Project Planning phase.  The first installment of this series can be reviewed by clicking here.  Subsequent segments will be aimed at additional phases of starting a BC/DR Program, on improving an existing BC/DR Program, and on elevating a mature program to a new level of efficiency and effectiveness.

The Project Planning Phase

It is important to understand that the project planning phase is a critical part of managing the project. Many projects fail before they begin due to inadequate planning at the outset.  Consider that you may deliver an incredible collection of project deliverables that check all the boxes for management in regards to content, presentation, and usefulness, but if those deliverables are provided late and/or over budget, the project will be considered a failure.  This needs to be spot on for success.  The quality of the deliverables, their timeliness, and the adherence to the established budget all need to be in line with the plan provided to management.  In addition, this phase may be the most difficult to execute successfully, especially for those new to project management.

Here are some of the items that need to be developed in the project planning phase:

  1. Work Breakdown Schedule (WBS)
  2. Milestones/Gantt Chart
  3. Cost Management Plan
  4. Communication Plan
  5. Risk Management Plan

In many ways each of these items is a project plan within the overall project plan.  The individual documents allow the management of the major aspects of the project.  It will take a considerable effort to develop them, but the work will be rewarded as they will serve as resources as the project progresses enabling you to stay on plan.

Work Breakdown Structure (WBS)

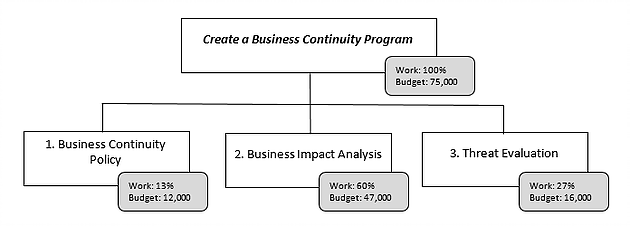
A WBS is a hierarchical breakdown of the deliverables of the project.  In creating the WBS, focus on the end goal and stay high level.  The WBS simplifies the project into manageable pieces that can analyzed for cost and efficiently managed for completion.  The WBS is a graphic representation of the project scope.  To start out, name the project and list the major deliverables under the project title.  Our project can be named Create a Business Continuity Program.  Earlier we identified three deliverables:

  1. Business Continuity Policy
  2. Business Impact Analysis
  3. Threat Evaluation

With the highest levels of the WBS graphed, focus on breaking down each major deliverable into smaller elements.   A good rule of thumb for breaking down the major deliverables is called 8/80.  The smaller elements of the deliverables should take between 8 and 80 hours of work to accomplish.  Go no smaller than eight hours for an element.  If an element takes longer than eighty hours, continue to break it down into smaller parts.  In addition, each work element should be completely independent.  There should not be any overlap between elements; each should be unique.  The elements may need to be broken down to different levels.  Some elements may require multiple levels of breakdown while others require none or few levels.  Do not feel as though all the segments need to be broken down to the same level.

Once the deliverables are broken down according to the 8/80 rule, attach a percentage representing the amount of work that element requires in relation to total work required for the project.  Indicate the budget allocated for that element as well.

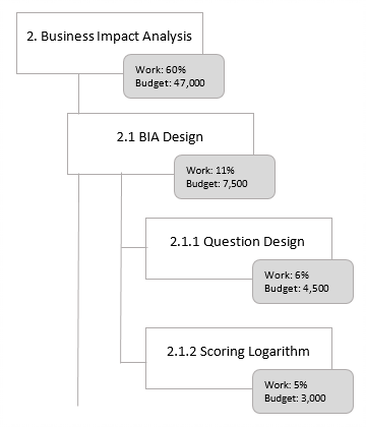
The 100% rule should be applied to the WBS.  The 100% rule holds that the top level of the WBS represents the total work and budget of the project.  The rule also holds that each level of the WBS should also represent 100% of that level’s total work and budget.  See below.

The high level deliverables should add up to 100%.  The levels below must also add up to 100%.  Here we can see that 2.1.1 and 2.1.2 add up to 100% of the work and budget for level 2.1.

There are many websites that provide information about creating Work Breakdown Structures.  Most include examples and templates that can be downloaded.

Milestones/Gantt Chart

Milestones are key events in the lifetime of project. Mapping milestones and comparing progress to them ensures that you are not too deep into the details of the project and are keeping the overall project on course.  The milestones of the project include critical deadlines, key dates unrelated to deadlines, and deliverables. A milestone chart is great for reporting and presenting to management since it summarizes the key stages of the project without getting too detailed.

Identifying the milestones involves setting a sequence to the major elements of the project.    To create a comprehensive milestone chart, refer to the work breakdown structure, but understand that milestones are not isolated to only items in the WBS. Consider also key organizational events and initiatives that overlap your project.  Also consider any periods in which the project team will need to focus its time and effort on other unrelated activities.

The timeframes for completing each milestone will vary greatly by the size of the organization and the staff that will perform the project activities.  The ability to outsource portions of the project is also a factor to be considered.  In calculating the expected dates for the project milestones, consider required predecessors.  Milestones will commonly require that one or more other key activities, deliverables, or other milestones are complete.

There are multiple templates available for milestone charts.  The link below provides templates for MS Office.

https://templates.office.com/en-us/Project-timeline-with-milestones-TM00000009

A Gantt chart further breaks down the items in the work breakdown structure into tasks with defined timelines for completion and relationships to other tasks that serve as predecessors and/or successors.  A Gantt chart can also be used to identify the resource(s) responsible for completing each task.

In a Gantt chart, each tasks is represented on a row.  A timeline appears along the top or bottom of the page, and a bar is drawn on the task row to a length representing the length of time required to complete the task.   The graphic below is a very rudimentary sample.

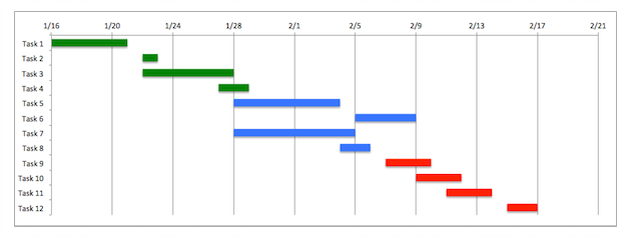
There are multiple software programs available for creating Gantt charts and many templates for creating them within MS Office.  Here is a link explaining how to create a Gantt chart in Excel.  If you feel it is important to link tasks together, visibly display connections between tasks and milestone icons, track resources, and involve constraints, it may be best to use a project management software program.

To create the Gantt chart, add the major elements from the work breakdown structure; then break out each major element into the individual tasks required.  Prioritize the tasks in accordance to how they may relate to each other and which tasks may be predecessors to other tasks.  In some cases tasks may need to be completed in tandem, but for our BC/DR project, linked tasks will most often have a finish-to-start relationship.  In a finish-to-start relationship, the predecessor task needs to be completed before the successor task can be started.  More information about task links is available here.

Review each task and draw the bar for each to represent the duration for the task.  Determine the resource responsible for performing each of the tasks.  When complete, review the resources assigned to tasks to ensure that no resource is over-allocated.

Cost Management Plan

The Cost Management Plan summarizes how project costs will be controlled.  The plan is not simply a summary of the expected costs for the project.  It includes a description of the method and manner in which costs are being estimated, and how the available budget will be periodically utilized.  It includes the estimated cost of each activity and a schedule of when costs will be incurred.  It also defines who has the authority to change the cost management plan and the procedure for how the costs are changed. The cost management plan should also define how costs will be reported and how often. Leverage the work breakdown structure in creating the Cost Management Plan.  In creating the WBS the budget amounts should have been tagged to each task.

For the BC/DR project, examples of cost contributors are the wages of the staff involved in the project, the purchase and implementation costs of any BC/DR and/or project management software (if applicable), the costs of outside consultants (if applicable), printing costs, the price of access to references such as those associated with historical disaster data, the wages of those who will be interviewed for the BIA, and the wages of those who will review and approve the BIA.  Travel may also be a cost depending on the delivery method for the BIA, and if travel is needed for the threat evaluation and/or meetings to present on the status of the project or the final project findings.  Your organization may have its own standard policies for what contributes to project costs.  For example, some organizations do not account for internal staff when determining the cost of a project.  Assuming that your organization does account for internal staff in cost planning, ensure that you include the time it requires to update the project planning documents and the status reporting required of management.  These activities are essential and should be part of the overall project cost.

Determine if your organization has a template for creating a cost management plan.  A template will greatly simplify the process.  If your organization does not have a template, there are a multitude of templates available on the web.

A cost variance action plan may be required for the cost management plan.  The cost variance action plan designates actions and identifies individuals responsible if the costs of the project begin to escalate beyond the original plan.  The cost variance action plan sets specific percentage category ranges and defines actions and escalation points of contact based on how far the cost of the plan has deviated from the original plan.

Determine if your organization requires your cost management plan to incorporate cost performance or cost variance metrics.  If so, there are a few additional project management concepts with which you will need to be familiar:

Schedule Variance (SV) is the completed work to date compared to the planned schedule.  We calculate the Schedule Variance by subtracting the Planned Value (PV)from the Earned Value (EV).

Step 1: Determine the Planned Value (PV) for the project.  Planned Value is calculated task by task for each task that should be completed at the current point of the project.  We need to look at each task and determine what percent complete it should be given the current date.

Look at the example below:

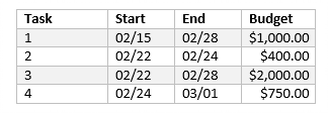
Let’s assume that it is March 1st. The Planned Value (PV) for the tasks that were planned to be completed by March 1st is $4,150.  This is simply the total budget amount for all project tasks that should be completed as of today.  (If the date fell within the start and end date for any task, we would need to calculate the per cent of the task that should be completed by the date.)

Each of the tasks above should be complete; however, Task 2 is only 75% complete, and Task 4 is only 50% complete.  Tasks 1 and 3 are 100% complete.  Now we can calculate the Earned Value (EV) of the tasks by multiplying the planned budget amount for the task by the percent completed of the task.

Task 1 = $1,000 x 100% = $1,000

Task 2 = $400 x 75% = $300

Task 3 = $2,000 x 100% = $2,000

Task 4 = $750 X 50% = $375

The Earned Value (EV) = $3,675

Now we can determine the Schedule Variance (SV)

Schedule Variance = Earned Value (EV) – Planned Value (PV)

Schedule Variance (SV) = $3,675 – $4,150

Schedule Variance (SV) = -$475

A negative Schedule Variance indicates the project is behind schedule.

Cost Variance (CV) is the difference between the Earned Value (EV) and the Actual Cost (AC) of the project.  If the cost of the project is over the budget projection, the Cost Variance will be negative.  You can determine the Earned Value for the project by multiplying the total budget of the project by the percent complete for the project.  For example, let’s say we have completed 15% of the project, and the total budget for the project was $75,000.  To date, we have spent $10,000.

Step 1: Determine the Earned Value (EV) of the project.

                EV = Project Budget x Percent Complete of the Project

                EV = $75,000 x 15%

                EV = $11,250

Step 2: Determine the Cost Variance (CV) of the Project

                CV = Earned Value (EV) – Actual Cost (AC)

                CV = $11,250 – $10,000

                CV = $1,250

                The project is currently under budget by $1,250.

There are multiple resources available on the web for providing project metrics like those above.  Here are just a few:

https://edward-designer.com/web/pmp-earned-value-questions-explanined/

https://pmstudycircle.com/2012/05/planned-value-pv-earned-value-ev-actual-cost-ac-analysis-in-project-cost-management-2/

http://www.pmknowledgecenter.com/dynamic_scheduling/control/earned-value-management-three-key-metrics

Communication Plan

The communication plan defines the data, frequency, and methods utilized for delivering information regarding the project.  Communication is essential to keep stakeholders informed and to manage expectations.  To develop your communication plan, start with documenting the audiences with whom you will need to communicate.  For the BC/DR project, this may include the following:

The Project Team – people working on and overseeing the project

Vendors – external organizations providing services for the project or systems like a BC/DR software

BIA Participants – those people who will perform assessments of business processes

Site Managers – individuals who may be helpful in performing the Threat Evaluation

IT Management – individuals who will be interested to know the business needs for system and infrastructure derived from the BIA

Vendor Management – individuals who will be interested to know the business needs for external organizations derived from the BIA

Department Heads – department leads who will review and approve BIAs and will need to understand their RTOs and the dependencies on their processes

Project Sponsor – the individual who approved the project and may be funding the project through their assigned budget

The list of possible audiences is varied; thus the type and frequency of information delivered will vary as well.  Meet with the audiences to determine what type of information they would like to see and how often it should be delivered.  Also, discuss the method of delivery.  E-mail, reports, in-person meetings, and virtual meetings may all be utilized for project communication.

To manage the communication requirements, it may be advantageous to create a communication matrix.

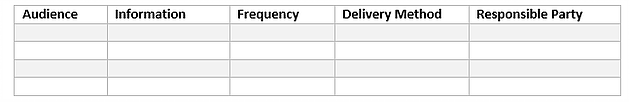
Adopt a standardized format for all communications.  Adhere to the defined format and remain consistent throughout the project.  If available, utilize a site on the organization’s intranet to store all communications and project-related documents.  Socialize the URL and provide links in the communications delivered.

Once the communication plan is developed, consider adding key communication activities to the Milestone and Gantt charts.  Create recurring reminders in your e-mail/calendar program to help ensure communications are executed according to schedule.

Risk Management Plan

The Risk Management Plan identifies the risks that pose a threat to the success of the project and captures related remediation activities.  For the BC/DR project, create a risk matrix.  The risk management matrix will facilitate the capture of risk information for the project.  Include the probability of each risk and a measure of the impact the risk would have on the project if it were realized.

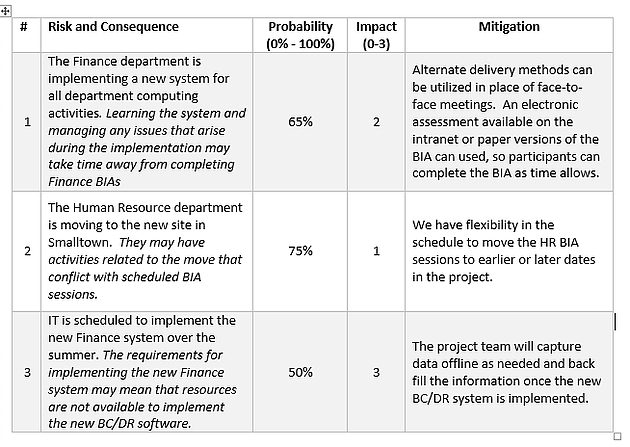
The probability ratings can also be captured as ‘low’, ‘medium’, and ‘high’.  Tasks with high probability and high impact are the primary concern.  These tasks can set the project back significantly or even require that the project be terminated.  Rank the risks in terms of probability and impact to facilitate efficient management of the project risk.  Think through the mitigation strategies carefully to ensure your project can be completed successfully.

Tasks from the mediation column of the risk matrix should be added to the project plan as they become applicable.  Be proactive wherever possible: if steps can be taken to avoid a risk, add those tasks to the project plan, and carry them out as if they were part of the normal work required.  New milestones may be necessary if any of the remediation activities are required in response to a realized risk.

With the risk management plan completed, you are through the project planning stage.  Keep in mind that each of the materials developed in this phase are living documents that will need to be updated regularly throughout the life of the project.  If managed properly, they will serve as valuable resources to help ensure success.

Avoid Common Disaster Recovery Plan Pitfalls

Disaster Recovery planning can be painstaking.  There are so many nuanced areas of focus that it is easy to miss key information that could hinder or block restoring systems and data within the time frames required by the organization.  Exercising plans is essential to help illuminate these hidden risks.  Here are some items we frequently find missing even in very mature disaster recovery plans.

1. Escalation Criteria/Requirements – ensure the plan identifies a clear procedure for escalating not only the detection of an issue that may require plan activation, but the procedure for notifying key contacts when the recovery is not going according to plan.  Contact information is essential, of course, but identifiable and measurable criteria that, if met, would require the notification of key staff members is often undocumented.  Without these guidelines in place, key performers will continue to bang their heads against a wall while the clock ticks away when a simple report on the road block or request for assistance could have easily saved valuable time.

2. Data Backup – Few IT professionals overlook data backup under normal circumstances.  That isn’t always the case when disaster recovery environments are being utilized.  Ensure that the plan contains instructions for enabling the backup of data being entered into DR systems.   The business users of the backup systems should also be alerted as to the RPO for the DR environment.  If the RPO is not socialized, the assumption will be that the DR systems have the same capabilities as production, and any loss of data in the event of a DR system failure would make the post-incident review more than uncomfortable.

3. Special Authorities – document the special access rights necessary to perform recovery tasks.  Do not assume that personnel with access will be available.  Capture the procedure for obtaining the IDs/passwords necessary in the event that key performers are not able to work.

4. Log of Actions/Events – capture a log of the actions taken during the recovery.  It’s unfair for management to assume that every decision made during the event will prove to be the right choice.  It’s not unfair to assume that a decision made was the right one based on the situation at the time when the decision was needed.  The ability to refer to a comprehensive log of actions and events will prove handy in responding to questions when reviewing the incident.  The log will also be useful as a means of improving recovery plans.

5. Failback Procedures – ensure that the plan contains the procedures to reverse any automatic or manual failover performed during the recovery.  DR plans are often remiss in detailing how to return to normal.  The process may not be as simple as a stepping back through the failover procedure.  Make sure the procedure is exercised and well documented.

The Work of Innovation

There is a common misconception that innovation involves people sitting around thinking about things until something groundbreaking comes to mind.  That abstract notion of what it means to be innovative and to bring an innovative thought to reality has next to nothing in common with the truth.  The easiest way to prove this is to examine a few job descriptions for innovation leaders/managers/contributors. Yes, you can actually get a job in innovation.  That is because the true form of innovation is hard work.  It is not as esoteric nor conceptual as most would believe.  It is a discipline that is much more similar to science than art.

Checking the job descriptions for innovative leaders and contributors, we can identify several themes.  These positions all require a mix of all or most of the following:

  • Experience in designing and applying a structured methodology to conducting tests/experimentation

  • A disciplined approach to evaluating problem statements and solutions

  • Experience in developing strategy statements and recommendations

  • Prior involvement with feasibility studies and the development of business cases

  • Ability to produce results individually and as a part of a dynamic cross-functional team

  • Ability to creatively apply technology to solve problems

  • Mature project management skills

  • Experience in gathering and analyzing consumer insights

  • Experience in gathering data and translating it into relevant implications and strategy

There is very little magic in the list above.  Judging from the requirements for working in the field of innovation, innovation largely consists of establishing and managing a scientific, measurable method of testing and evaluating a possible solution for feasibility and effectiveness against the strategic goals of an organization.  In other words, innovation is hard work.

This means that organizations who are typically thought of as ‘innovative’ are not beating their competition with some type of complex creative thought that is innate and gifted to a select few employees of that organization.  These organizations are not winning because they have managed to secure more high-level creative type employees than their competitors.  They are not lucky, nor have they discovered the secret to harnessing the portions of the brain that most of us cannot.  They are quite simply working harder than everyone else, and they are doing it consistently.

Starting a Business Continuity/Disaster Recovery (BC/DR) Program

This series is dedicated to providing direction for applying Project Management principles to starting a Business Continuity or Disaster Recovery (BC/DR) Program.  This is the first installment of a multi-part series.  In this installment we will focus on the Project Initiation phase.  Subsequent segments will be aimed at additional phases of starting a BC/DR Program, on improving an existing BC/DR Program, and on elevating a mature program to a new level of efficiency and effectiveness.

Starting a Business Continuity Program

Launching a BC/DRBC/DR Program requires its own plan.  This is not a plan as in a recovery or response plan, but a plan in the sense of a project plan.  Starting a BC/DR is no different than starting any project, and success essentially hinges on your project management skills.  You may want to reach out to the Project Management Office (PMO) if you are fortunate enough to be part of an organization that has one.  The PMO may be able to provide an experienced project manager who can assist by applying current project management theory and techniques to the initiative.  If your organization does not have a PMO, or a resource is not available, then gaining a basic understanding of project management is the starting point.

There are many available information sources for project management principles.  The Project Management Institute (PMI) http://www.pmi.org/ is the leading authority in the field.  The PMI offers training and certification and most community colleges and universities offer courses in project management.

So let’s take a real-life approach to this and assume that you were invited into your supervisor’s office or your supervisor’s supervisor’s office on Friday afternoon, and, due to some outstanding work in a field that has nothing to do with business continuity or project management, you were “offered the opportunity” to start and lead the organization’s business continuity program.  You will do this, of course, while managing your non-business continuity, non-project management work responsibilities.  I feel your pain.  So, here’s where you are: you didn’t sleep much this weekend, you have a huge new project in your lap along with a bunch of other things on your already-full plate, and you’re probably not getting enough time, money, or people to make it happen.  Step 1 – keep reading.

This is still a project, and we still need to approach it as such despite the possibility that we are short on time and resources.  Here are the basics we need to know about project management and its application to starting a BC/DR.

Project Initiation

Project initiation is the first phase of project management.  Project Initiation is typically where a business case is created to provide the rationale for undertaking the project and proving that it is feasible.  Management will use the business case to ultimately determine if the project will be approved.  This may have already taken place and the project assigned to us after the fact.  If, however, we will be part of creating the business case, there are a ton of templates available online as well as recommendations for writing a good one.  Check internally first because there may be a standard template specifically for use by your organization.

The Business Case for a BC/DR
The business case needs to explain the why for performing the project.  Focus on describing the need for the project and how it solves an issue that the organization is facing.  Provide examples that are not exclusively IT focused as this can expand the scope of the case beyond traditional boundaries and allow areas like Supply Chain, HR, and other customer impacting areas to be included or considered. Without a BC/DR Program, the entire organization is at risk.  The organization could experience a disruption that causes injuries to associates and/or the inability to provide the products and/or services normally provided to clients.  Without a BC/DR Program there is a risk in regard to providing the safest possible working conditions for employees, and there are operational risks that could include regulatory and contractual breaches, diminished reputational status, financial loss and loss of financial opportunity, and a diminished competitive capability.

The goal of the project is the creation of a program that is focused on improving safety for all personnel and raising the state of readiness for the organization by understanding and mitigating risk and instilling an ever-improving culture of resilience.  The business case should demonstrate the value of performing the project.  For this part refer to the Business Continuity Institute (BCI). http://www.thebci.org  The BCI is a leading authority in the field of business continuity.  The BCI offers a paper for download that details how business continuity delivers ROI.  http://news.thebci.org/news/business-continuity-delivers-return-on-investment-164635  This section can also leverage relevant industry requirements.  These are often the driver for the creation of a BC/DR Program.  Depending on the industry, the ability of an organization to continue operations can hinge upon proving it has an effective BC/DR Program.

While the benefits and ROI of implementing a BC/DR Program can be difficult to express numerically, one way to do so is to establish the cost of downtime.  The factors involved in determining the cost of downtime will vary greatly from industry to industry and organization to organization, but if we can have a few minutes with the CFO, we may be able to derive a dollar amount that can adequately highlight the value a BC/DR Program will bring.  (The CFO would make a great Executive Sponsor – keep this in mind for later.) Ask for an estimate of the losses expected for a day where no work activity could be performed.  If you are part of an organization where the products and services provided are extremely time-sensitive, the cost of downtime may be measured in hours, rather than days.  In either case, the value of a BC/DR Program is in improving safety for employees and mitigating against the cost of downtime.  Be careful not to infer that a BC/DR Program will ensure safety or that downtime can be completely avoided.  A BC/DR Program can only promise to improve safety and minimize downtime.

The business case will also need to detail the requirements for the project.  In this section we need to provide information on what will be done, who will do it, how it will be done, and the timeline (when) for completion.  Who will depend on how many people we can involve.  If it’s just going to be you, you may want to include estimates for contracting with outside consultants.  If it is just you, be savvy with the timeline estimate because the revision process for the business case will most certainly include shortening the project time frame.  These project requirements will set you and the organization up for success.  Understanding your current team’s high-level bandwidth, level of effort, and deadlines will help you determine the resources required to meet your project goal.  We see too often organizations asking employees to “Just Do it!” and these eager employees struggle with trying to do more with limited resources.  Planning will provide a logical progression to achieve success and meet your organization’s goals.

We can be more certain regarding what will be done and how it will be done.   Here are some traditional deliverables (what will be done) for the project:

  1. Business Continuity Policy

  2. Business Impact Analysis

  3. Threat Evaluation

Understand that there is a debate within the Business Continuity industry over whether to perform the Threat Assessment or the Business Impact Analysis (BIA) first.  We will not wade out into that discussion in this installment; although you can see we’ve placed the BIA before the Threat Evaluation.  Our position is that the BIA should come first; however, there is enough flexibility in the sequence that they can be performed concurrently if desired.

The Business Continuity Policy will establish the requirements and responsibilities for the BC/DR Program.   The Threat Assessment will examine the likelihood, impact, and state of readiness for threats to the organization, and the BIA will establish the Recovery Time Objective (RTO) for the processes engaged by the organization.  (The RTO is the measurement of time in which a business process or service must be recovered following a disruption.)  Note that we are referring to our deliverable as a Threat Assessment, rather than a Risk Assessment.  These are two different things.  A threat assessment is identifiable with standard business continuity procedures while a Risk Assessment is wider in scope.  The Threat Assessment and BIA will provide the background and organizational understanding for establishing the program.

Prior to writing the Business Continuity Policy, it will be helpful to review a few resources:

The documents above will give you the essential steps for completing the tasks required to starting a program, and, more importantly, will provide you with an overall understanding of what is necessary for establishing a successful BC/DR Program.

As you formulate the Business Continuity Policy, cite the need for a Steering Committee.  The Steering Committee should include an executive sponsor – someone from upper management who agrees to serve as the chair of the committee.  (Recall the reference made earlier to the CFO.) The executive sponsor provides a valuable top-level presence to the program, functions as the voice of the program to other members of executive management, and assists in avoiding and ending impasses that could occur between equals.  Include a suggested structure for the Steering Committee.  In addition to the Executive Sponsor/Chairperson and the BC/DR Manager, propose that leadership from the business areas of the organization also serve as committee members.  Their support for the program will be essential to long term success.  We will eventually request each business area participate in the BIA and in building and maintaining recovery plans.

 Designing and delivering an effective BIA is a major endeavor.  The Business Case should include the BIA scope, design, and delivery method(s).  There is some cross over here between Project Initiation and Project Planning.  We will need to plan the project at least at a high level in order to provide an idea of the scope of the BIA.  Determining the scope of the BIA is the first task.  The size and structure of the organization as well as the staff that can be allocated to the task will be considerations.  If the staff is not considerable, but the size of the organization is, it may be necessary to implement the BIA in carefully planned phases or to narrow the scope to a limited portion of the organization.  Part of that determination should include the implementation method(s).  Face-to-face meeting are preferred, but they may not be feasible given resource restrictions.  The use of a business continuity software tool may  help as well.  Distribution of electronic files developed in Word or Excel can be effective, but compiling the data for analysis and reporting can be time consuming.  A blended approach to implementation is often required given restrictions on travel and staffing.  If company culture allows consider engaging an external consulting firm to collaborate on the design and provide the delivery of the BIA.  This may be the best possible use of any financial resources the project may include as the results of the assessment will be delivered along with external endorsement.

As for BIA design requirements, capture the need to measure impact using a qualitative and quantitative method.  Many organizations allow BIA participants to provide their opinion on how serious the impact of the outage would be within their area of specialization.  This is not recommended as most people are passionate about their work and find it difficult to provide an estimate of impact without allowing that passion to bias their assessment.  If specific criteria are provided for determining impact, the BIA results are more likely to represent an accurate depiction of how an interruption would affect normal activities.   This will be vital for selecting appropriate recovery strategies later.  Include the time frames in which RTOs will be expressed.  Provide a Tier structure that defines how processes will be categorized.

The policy should also state that the BIA will capture dependencies on IT assets and vendors.  Speaking with IT leadership is advised as IT may already have RTOs and classifications for applications and assets.  Sharing the same measurements, if possible, will simplify the mapping of IT dependencies and the identification of gaps between business needs and IT capabilities.  Detail the need for IT to provide current application Recovery Time Actual (RTA) and Recovery Point Actual (RPA) information.  The RTA is a measure of time in which it has been demonstrated that an application or other IT asset can be recovered.  The RPA is a measure of time indicating the true age of the data associated with an application that can be recovered by IT.   In some cases a disruption may mean that data entered into an application will be lost if it was entered within a certain time period prior to the disruption.  These measurements will ideally come from the results of IT recovery exercises, rather than estimates of what is currently possible.

Include the minimum requirement for refreshing the BIA in the policy.  Many organizations will perform the BIA on an annual or bi-annual basis.  The available methods of delivery and staffing will factor into how often the BIA can be repeated.  If a software tool to support the BC/DR Program is available, indicate that the BIA should be updated whenever there is a change in how a process is performed, where it is performed, or if the technology utilized or the role of a supporting vendor is amended.  Maintaining BIA data continually allows the organization to be more confident in the selection of strategies for recovery and more efficient in managing the resources allocated to enabling those strategies.

The Threat Evaluation should provide a score for potential threats to the organization that considers the likelihood of the threat and the expected impact if the threat were realized.  The Good Practice Guidelines provides a useful scoring model for threat assessments.  Enhance the model by accounting for any mitigation measures in place to reduce each threat.  This will ensure that the most likely and most impactful threats come to the forefront.  In order to determine the likelihood of each threat, examine historical disaster frequency data.  Here are a few websites that may be helpful:

https://www.unisdr.org/we/inform/disaster-statistics

https://ourworldindata.org/natural-catastrophes/

http://www.ifrc.org/world-disasters-report-2014/data

http://www.emdat.be/database

https://www.fema.gov/disasters/grid/year

Understand that accounting for every conceivable threat is not possible.  Try to keep the analysis simple.  The assumption should be that both the BIA and the Threat Assessment will evolve and improve over time and as the organization changes.

The policy should include specifics for program assessment and reporting.  Include information on the standards that should apply to the program based on your review of IS22301 and other relevant industry-specific requirements.  Your location in terms of state/province and nation may require additional compliance standards for the program.  The standards ultimately adopted by the organization, as well as those applied by your industry and government entities, will drive much of the design of the status reporting that is necessary for the program.

Internal and external audit findings should be part of the program reporting requirements.  Reach out to the Internal Audit Department if possible to request a collaborative effort on areas of compliance and to introduce them to the relevant standards.  For BIAs, include reporting on completion rates, updates, reviews, and overall approval statuses.  Outline reporting on the RTO and Tier results from the BIA.  Reports detailing dependencies and any gaps between business needs and IT and vendor capabilities should be outlined.  Sample Threat Assessment reports are available online.  The threat assessment is not something that will need to be refreshed often.  It will rather be repeated for all locations for the organization and for newly acquired locations should the organization experience growth.

Following the advice provided here, a very persuasive business case can be developed to support the need for a BC/DR Program.  With the steps provided herein completed, we are through Phase 1 of the project.  Watch this space for the next installment covering Phase 2 – Project Planning.

Monday Morning Quarterback Review of the 2011 Indianapolis Colts and Risk Management

While a debate regarding who is the best quarterback in the National Football League would certainly include multiple viewpoints, there is little disagreement among those close to the sport about which team can best do without its top passer.  Over the last several years it has become generally accepted that the team least capable of succeeding without its starting quarterback is the Indianapolis Colts.  The Indianapolis Colts have enjoyed tremendous success since they drafted quarterback Peyton Manning first overall in the 1998 NFL draft.  Manning started at quarterback immediately, and the team has failed to qualify for the NFL playoffs only once since his rookie year, averaging 11.5 wins per season since 1998.  Over that period Manning has amassed four Most Valuable Player awards, and he has led the Colts to two Super Bowl appearances, winning against the Chicago Bears in 2007.  Having come to expect such a high-level of play, the 2011 version of Colts must be difficult to bear for fans.  Manning has been sidelined all year due to offseason surgery.  In his absence the team has posted a record of 0-8, while being outscored by an average of 32-15.

​​So what went wrong?  The Colts, like many organizations both in and outside professional sports, were not adequately measuring and thus mitigating risk.  Risk is calculated by multiplying the probability that an event may occur by the expected loss that would result. (Probability  x  Expected Loss)  The Colts have had very little experience without Manning in the lineup.   He had started every game over the course of his career, and was a threat to break the record set by Brett Favre for most consecutive games played.   On the other hand, both experts and casual fans alike were aware of the impact that Manning’s absence would have on the team and the fact that he had offseason surgery in May with aggressive estimates for recovery at two to three months.  In addition, it can be argued that with Manning now thirty-five years old the team should have been planning for a successor regardless of his health.  Since the expected loss was clearly extreme, the Colts likely made their mistake in judging the probability of Manning missing significant time.  In calculating probability the team needed to factor Manning’s consecutive games played streak along with his surgery and the fact that he is at an advanced age for a professional football player.

Having miscalculated the risk that their All-Pro starting quarterback would miss significant time, the Colts failed to adequately mitigate their risk.  An easy way to remember mitigation options is to categorize them into the Four Ts: Terminate, Transfer, Treat, and Tolerate.  Terminating risk involves not taking a specific course of action or the elimination of the activity causing the risk.  For most organizations this might mean passing on an investment or expansion opportunity or ceasing to operate in an area that is prone to a natural disaster like a flood.  In the Colts case termination was not an option.  The team couldn’t refuse to play until Manning returned, nor could they simply stop the regular season from beginning on the scheduled date.

​The Colts were also largely unable to transfer their risk.  Transferring risk involves shifting the responsibility for loss away to a third party.  A transfer of risk can be executed through arranging for insurance through an insurance provider or through other types of contractual agreements.  The nature of professional sports does not allow for the transfer of risk related to player availability.  Teams carry multiple players at each position.  The expectation is that an injured player will be replaced by another player from the team’s bench.  The Colts did have the ability to transfer their risk of financial loss related to Peyton Manning’s health.   Teams will often take out insurance on highly-paid players to cover losses in the event that the player is injured and unable to play out the term of their contract.  The Colts have a large investment in Peyton Manning and would be liable to pay the guaranteed portion of his salary regardless of whether he ever plays another game for the team.   Teams may also include injury payout terms in player contracts.  These clauses define the amount to be paid to player in the event of an injury.  Injury payments are usually much lower than the value of the contract providing significant financial protection for the organization.

Treating the risk that Peyton Manning would not be able to play was the Colts best option.  The Colts allowed several opportunities to treating their risk slip away.  Their first chance was through the NFL Draft.  The draft allows NFL teams to select new players from college or elsewhere while providing the team with exclusive negotiating rights to the player.   The Colts had five selections in the 2011 draft and did not use any of their picks to select a quarterback.   How much the team knew about Manning’s health at the time of the draft is unknown, and the draft took place in April ahead of Manning’s first surgery in May.  Regardless of the timing of the draft and the surgery,  the Colts should have been planning for a successor to Manning by drafting a quarterback in this or a previous year’s draft.  None of the players would have been a true replacement for Manning, but the team would have been in a better position to compete in 2011 had they selected a young quarterback.

​The Colts had an additional opportunity to treat their risk during the NFL free agent signing period.  Free agents are players who have played out their contracts and are free to negotiate with any team.  In the Colts defense, there are complications with signing free agents.  Depending on their current status, signing a player may require that future draft picks be provided to the player’s former team as compensation.   In addition, all player contracts have implications with regard to the league’s salary cap.  Better players command higher salaries requiring teams to use more of their cap space.  The Colts were mostly inactive during free agency.  The free-agent signing period began on July 29th.  On August 25th the Colts signed Kerry Collins.  Collins was signed too late to participate in a full training camp and had just over two weeks to prepare for the regular season.  Collins had been a very good player in the league, but he was 38 years old when the season started, was headed for retirement, and had not played a full NFL season since 2008.  Despite the challenges, Collins entered the regular season as the starter.  He has since been injured and has not played since the third week of the season.

​Signing Collins was a desperate attempt to address the risk that the Colts had failed to accurately assess and treat prior to the start of the 2011 NFL season.   Properly treating risk involves taking definitive steps to minimize the likelihood and/or impact of the risk.  For most organizations this can mean re-engineering the processes or activities where risk is identified or leveraging the organization against financial losses.  Regardless of the steps taken to treat the risk, a plan for monitoring and measuring risk needs to be established as conditions will change impacting the likelihood and impact of risks and thus changing the implications for the organization.

​In some cases the options for treating risk are more costly to implement than the potential impact of the risk itself.  The impact of a risk may also be deemed to be at an acceptable level, while in certain circumstances a risk may be considered unavoidable.   In these cases risk will be tolerated.  For the Colts tolerating the risk of Peyton Manning’s injury is all that remains.  Having miscalculated their risk, failing to successfully treat it, and being left without the option to transfer or terminate it, the Colts are left

with Curtis Painter as their starting quarterback.  Painter was a sixth-round draft pick in 2009.  Prior to this season, he had only thrown 28 passes in the NFL.  The Colts management may publicly state that they have confidence in Painter; however, the late move to sign and consequently name Kerry Collins as their starter indicates otherwise.  So it would seem that for 2011 both Colts fans and football fans in general are left to tolerate their performance on the field.  We hope that your organization doesn’t fall into a similar situation.

Should Your Organization Use Business Continuity Software?

The debate over the use of software for business continuity planning is typically focused on the perceived value of the system functionality. Software vendors champion their automation features while critics cite the licensing cost and the complexity of implementation and administration. Most organizations hinge their final determination on whether the system capabilities are viewed to be worthy of the resources required to use the tool properly. This analysis is often flawed in that many organizations perform their evaluation while focused solely on current software capabilities and organizational requirements in conjunction with the present state of business continuity. The advantages of properly implemented business continuity software only expand as an analysis matures to include the long-term goals of the organization and the direction of business continuity as a whole.

The functional benefits of business continuity software are numerous:​

Business continuity software facilitates global data updates by cascading individual changes throughout the system. This marks a direct return on investment that increases as the system is configured to import from or link directly to external systems of record.​

Software improves standardization across the enterprise. While a document template will facilitate standardization to a certain degree, business continuity software typically allows administrators to enforce planning requirements using security and planning wizards/assistants/navigators. Planners must work within the framework designed for them. Many software packages allow for plan completion tracking and reporting of completion rates across the enterprise.

Most software packages allow end users to map recovery dependencies illuminating relationships and enabling the remediation of exposures. When plans are developed in silos, the risk that recovery time objectives are not supported by predecessor business processes and/or information technology systems is magnified.

​Software allows data integration across modules. Many software systems have evolved to include modules for business impact analysis, emergency notification, and incident management. Sharing the same database allows these software systems to support data sharing between plans, BIAs, emergency notification systems, and incident management tools.

​The latest versions of business continuity software have dramatically increased their level of continuity intelligence. Some vendors have developed planning tools that incorporate guidance based on current industry standards such as BS25999. The standard plan wizards/assistants/navigators include industry-specific methodology and allow for the further customization of end-user guidance.

Business continuity software facilitates responses to organizational changes. As organizations restructure, the storage functionality in most software packages enables plans to be relocated to reflect changes in business structure or geographical footprint. Plans can target the response and recovery of locations, business processes, applications, or network nodes. More importantly if a current plans scope is to be divided across multiple plans, some software offers the ability to move a central component with all of its recovery details between plans. This type of change in word processing tools or spreadsheets is manual and cumbersome.

Evolving planning initiatives are accommodated more freely through software. The risks highlighted by events just over the last few years have renewed the industry focus on exposures associated with pandemics, nuclear energy production, and supply-chain resilience. Planning wizards/ assistants/navigators can be updated to address these new initiatives and assigned to all or specific plans quickly. These planning tools can be enhanced to deliver instructional details for meeting new organizational guidelines and standards and to assist planners as they work to capture steps for addressing new threats. In the ever-changing business continuity landscape, this is critical.

​Software supports the creation of business continuity metrics. A relational database allows the creation of complex reports that summarize business continuity information across all plans. Management increasingly requires an enterprise-level view of the current state of preparedness in order to determine program direction. Manually gathering data from documents for the creation of metrics is a monumental task, and few organizations are staffed at levels that allow for the consistent and continual collection of the required information. In the absence of a database, the generation of metrics will be too infrequent to provide value. Additionally, if metrics data must be compiled manually, there is a much greater risk of error. Strategy development is hindered if there is a lack of confidence in the accuracy of data and its ability to be representative of the entire organization. Management may be reluctant or unwilling to act on the information. As a result planners will view their work as less meaningful to the organization.

​Implementing BC Software will drive program commitment, innovation, and advancement:

​Implementing software for business continuity planning improves the individual sense of plan ownership. Recent business continuity standards speak to the need to move beyond plan creation to the creation of an organizational culture of resilience. The goal is an embedded sense of risk awareness. Planners must be conscious of threats to safety and normal organizational activities, and they need to view their continuity plans as integrated components of normal processes. Creating that elevated sense of ownership is easier if planners recognize a significant investment of resources in support of resilience. Ironically, key aspects of the argument against business continuity software – cost and the challenge of implementation – become psychological allies in creating a resilient culture. The investment in business continuity software sends several impactful signals to the planning community. The first is that the program is not only approved but directly supported by senior management. Planners will view the dedication of financial and human resources as a tangible measure of the importance of the initiative to the overall organization. Planners will expect that their use of the tool and the output of their work will be evaluated. This valuation is enhanced as key stakeholders are involved at critical points in the system development life cycle and in the governance and change control processes.

​As business continuity tools facilitate summary reporting, senior management can further mold a culture change by acting on the data and addressing exposures. If the data collected by and reported from the system is acted upon and creates change, planners will see the direct value of their work and view the effort to create a resilient culture as sustained. This is not to say that an organization cannot create and sustain a resilient culture without software. The challenge is much more significant, though, if the end users cannot identify a direct connection between the communications regarding the importance of the initiative and the resources dedicated in support of it.

​The determination on whether to implement business continuity software should incorporate future organizational needs and the direction of continuity as an industry. The means of creating plans needs not only to support the planning requirements for today, but it should be flexible in adapting to the changing needs of the organization. The content currently mandated for plans will evolve as the organization changes. As new threats emerge, the device where plan data is captured will need to allow for that evolution. The question to ask is does the current mode of planning provide the agility necessary to change the criteria for what is now considered a comprehensive and actionable plan? In the case of isolated, unrelated documents created using a template based on the organizational needs of the moment, the answer is no. Planning tools must be capable of supporting the regular revision of requirements and the distribution of new guidelines as the organization changes, new threats emerge, and new compliance standards are applied. Organizations using business continuity software will find it easier to revise planning requirements and implement them across the enterprise than those organizations using templates for word processing or spreadsheet programs.

​Trends in business continuity further the argument for the use of software:

​Continuity programs are increasingly finding themselves reorganized within the realm of risk management. It is a logical change. Business continuity bridges the gap for risk management by protecting the organization from prolonged outages caused by random events and from the cumulative related effects of an event that are difficult to identify through typical risk analysis. As a discipline of risk management, business continuity will be increasingly required to quantify resilience capability. One way software has begun to address this need is the concept of a continuous business impact analysis. For most organizations a business impact analysis is a yearly or less frequent endeavor. There is software available today that facilitates a continual BIA update capability in conjunction with the traditional plan update capability. These tools allow organizations to continually review current impact information rather than cycling BIA efforts on a yearly or less frequent basis. The focus of these tools on impact allows them to more closely align business continuity with risk management. If a more frequent or continual analysis of business impact is needed in the future, data must be captured so as to easily be revised, collected, and summarized. Continuity software provides a decided advantage in this regard.

​An increasingly closer alignment with governance and compliance standards is also emerging in the field. Business continuity governance and compliance is not new; however, the standards are more refined, the number of industries held to stringent guidelines is increasing, and the standards are revised more frequently than in the past. There are several software systems currently available that incorporate the more recognized standards and provide a means of measuring compliance. Until recently these capabilities were limited if available at all. Some of the more robust systems not only include the capability of guiding users toward the creation of compliant plans, but allow for the measurement of plan compliance. Administrators can select the applicable standard and generate data to determine the current level of compliance. This is a major step for business continuity software as earlier generations of these programs provided only the means for creating plans while assuming the user was well-versed in continuity.

The recent software advances highlighted here point to a final trend for the industry. The number of business continuity software vendors has grown exponentially over the last few years. Their success will depend upon their ability to outperform their many competitors. The consumer clearly is the beneficiary with this increase in competition. The result will be valuable gains in functionality, ease of use, business continuity intelligence, and more competitive pricing. Increased competition will also mean more rapid responses to changes in the industry, and improved responsiveness to their client needs. The BC maturity gap between organizations utilizing continuity software and those that are not will only widen as software capabilities become more robust.

​Organizations that implement business continuity software will derive functional and non-functional benefits providing them with a competitive advantage that will only widen as business continuity moves into the future. The evolving demands on continuity programs are too great to be managed in a means that was not intended specifically for business continuity.

The Barbarino Test for Actionable Plans

Vinny Barbarino was a likeable character on a 1970s sitcom called Welcome Back Kotter. Welcome Back Kotter featured Gabe Kaplan as a Brooklyn school teacher charged with the education of some very unique students who had little interest in their studies. Barbarino, played by John Travolta, was the ringleader of the crew. He was famous for attempting to extricate himself from sticky situations by feigning complete ignorance of the subject matter. With a confused look, Barbarino would pose the following questions to Mr. Kotter: Who? What? Where? When? Barbarino’s ploy never fooled Mr. Kotter, but it can be a useful means of establishing how actionable recovery plans will be in the event of a disruption. Try the Barbarino Test to determine how actionable your plans are. Does your plan answer who, what, where, and when?

Who? Your plan should answer who with contact information. Call trees are part of the answer, but ensure you have multiple contact methods for any organization or person with which you would need to communicate during a recovery. Think about employees, vendors, customers, emergency management personnel/organizations, health care providers, and government organizations. Think about key skill sets and who possess them. Include backup personnel with the same capabilities. Document alternates, and account for the chain of command, or line of succession for your organization.

What? Think about exactly what needs to be done to recover. The heart of an actionable plan is a detailed list of the procedures required for recovery. Leverage standard operating procedures and adjust them as needed assuming that your normal workplace is unavailable. Think about the level of detail required so that someone less familiar with the procedures can still execute them. There is no guarantee that key personnel will be able to work. Include workarounds for unavailable IT systems and data.

Where? The plan should include where people will perform their recovery responsibilities. The normal workplace is not available, so where will you go? Include directions for people traveling to recovery sites. Include contact information in the who of your plan for the people that provide access to the sites you need. Account for the space available and the number of people planning to work at each location. Ensure that the people who will work remotely have been provided with the right equipment and training to make the connection to organizational networks/data/systems.

When? Account for when things need to occur in order to recover. If you are responsible for business processes, rank them in order of criticality. Document all recovery prerequisites and dependencies. Create a sequence for the necessary actions to be executed. The proper recovery of IT systems is often tied to successfully sequencing the order in which things are brought back online.

Do you think you have it all in place? Prove it – exercise the plan. The Barbarino Test is a decent guideline, but plan exercises/tests are the only way to know if your plan is truly actionable. My son continues to be frustrated when he doesn’t hit the ball over the heads of all the other kids at his tee ball games. The vast majority of organizations are satisfied with having untested plans. What do these things have in common? I continue to tell my son and all the organizations that I work with that it doesn’t make any sense to think you will be great at something you have never done before. Your organization shouldn’t act like a five year old. Put the Barbarino Test and your plan to action. Learn where the plan gaps are, and address them; then test again. If you follow these simple steps it will keep your recovery from looking like a 1970s sitcom.

Automatic

When I was learning to drive, my Mom told me I had an advantage. It would be easier for me than it was for her because I could focus on learning to control the car. When she learned to drive, it was more difficult because in addition to learning to handle the car, she also was learning how to shift gears manually. I couldn’t argue that. I was holding the wheel tightly with two hands and had a hard time imagining using one hand to try to shift at the same time. ‘Automatics’ were easier, she said.

Large organizations have an inherent advantage as it pertains to resilience. Shifting workload from an affected site to an unaffected site with similarly skilled staff is a strategic option only large dispersed organizations can consider. It is a common strategy option for both big private and public entities. The plans we see frequently call out workload shifting in the recovery procedures. When looking deeper into this strategy, many organizations have done little else besides capture it in their plans.

Bigger does not mean better. Not when the size of the organization leads planners to believe that workload shifting is automatic. The likelihood that plan builders have made unsupported assumptions in their recovery plans is much higher for a large organization than it is for a smaller one. Planners at smaller organizations are much more aware of limitations. At large organizations planners commonly assume that “there is someone who does that”, and that this unnamed individual or group will “do that” when something goes wrong. The problem is that the people who are being tasked with these specific responsibilities often have no idea what has been assumed of them.

Assumptions made in regard to what other individuals and groups are capable of and plan to do in an event are a common gap to be aware of in recovery planning. This is a key area of concern whenever all or part of the recovery strategy is workload shifting. Ensure that the receiving entity is well aware of the strategy and can manage the added workload within expected time frames. Make sure the IT requirements to shift the workload have been detailed and are part of the IT recovery plan. In short, as with any strategy, exercise the procedure often. Exercising the ‘manual’ requirements for workload shifting is the only thing that will make it feel automatic when it is necessary to implement the strategy.

Can We Talk Here

The more I work with different organizations around the world, the more I realize that we can’t talk here. “Here” meaning the industry of business continuity. Joan Rivers’ catch phrase was effective for decades at eliciting laughter. Our dysfunction as it regards the still challenging effort to adopt a formalized language for our industry is only effective at eliciting confusion, frustration, and uncertainty.

This should not be an issue. Not if comparing Business Continuity to fields such as medicine, technology, or law. Each has had quite a heard start on us; however, the vastness of those fields dwarf business continuity and the rate of change as it pertains to language is much higher. Despite those challenges, medicine, technology, and law, as well as many other fields, have standardized their languages better than Business Continuity.

It is not for a lack of effort. BSI published BS25999 in 2006 and continues to make efforts to educate on Organizational Resilience. ISO 22301 has since become the standard of choice for compliance. Both standards include sections on terminology. Industry leading organizations such as the Business Continuity Institute (BCI) and the Disaster Recovery Journal offer online glossaries for Business Continuity.

What has also become apparent is that the lack of standardization is predominantly a matter of choice. We don’t have an issue with the socialization of a standard language as much as we have a refusal to accept it on behalf of a measurable percentage of industry practitioners. The usual explanation I receive for the conscious choice to avoid proper industry terminology is that the organization has used certain terms for a long time and changing them now would be very difficult.

So how do we fix this? Tactfully addressing inaccuracies wherever we see or hear them is a start. This can mean engaging in uncomfortable exchanges, but if we don’t, who will? Continuing to speak and write in proper terms and directing people to accepted sources of information is less daunting and may be more effective. Eventually, we will get to a point where we can all talk “here”. We have to, or we will literally die not trying.